Core Networking · Study deck

Network Performance Lab: Calculations and Experiments

A protocol header is the control information placed before a message's payload, the sensor data it carries.

Packet Pete is your guide for this deck.

performance
iotclass.org

After studying this chapter

Learning objectives

You will be able to:

  • Calculate protocol overhead and transfer time.
  • Run performance experiments and compare expected output.
  • Explain: A protocol header is the control information placed before a message's payload, the sensor data it carries.
  • Explain: The first arrow leads to throughput, the bits actually delivered, and the label on the way tells you what was taken: loss and retries.
iotclass.org

Major section

Start With the Decision

A protocol header is the control information placed before a message's payload, the sensor data it carries.

  • On a small message, the header can take most of the bytes.
  • Bandwidth is how much data a link can carry in a given time; latency is the wait for a message to arrive.
  • A calculation and simulator run show where the time and bytes go.
iotclass.org

Major section

Try It: Protocol Overhead Calculator
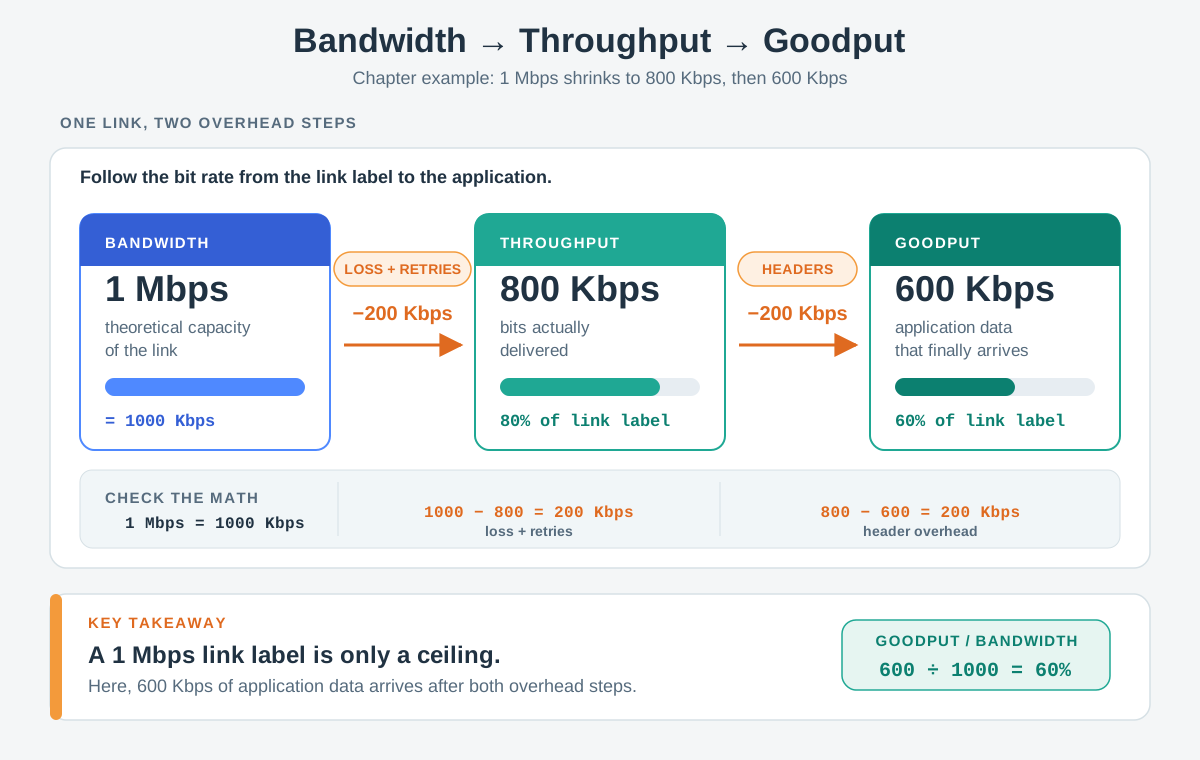
The first arrow leads to throughput, the bits actually delivered, and the label on the way tells you what was taken: loss and retries.

  • The second arrow leads to goodput, the application data that finally arrives, and there the cost is headers.

Key terms

Each step
Each step is a different kind of overhead, charged by a different part of the stack.
Diagram showing the relationship between bandwidth, throughput, and goodput with typical loss factors
iotclass.org

Major section

Circuit Diagram

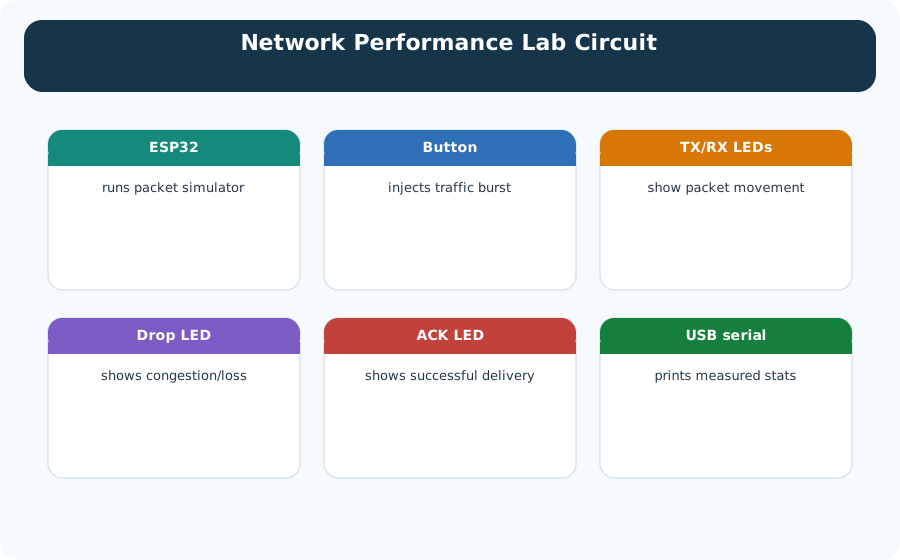
The button is the only input; pressing it injects a burst of traffic, which is how you drive utilisation up on demand.

  • The three LED groups then report what the burst did.
  • The serial link back to the computer carries the numbers.
Circuit diagram for network performance lab showing ESP32 with LED indicators and button input
iotclass.org

Major section

Bandwidth Alone Does Not Cut Latency

The Mistake: "We upgraded from 100 Mbps to 1 Gbps, so our IoT sensor latency should decrease 10x.".

  • The outcome depends on packet size, load, and the full path.
  • Total latency: ≈1–100 ms from the listed components, so the 7.2 µs saved in serialization is negligible.
  • Depending on the bottleneck, reduce queue load, improve scheduling, shorten the path, move processing nearer the sensor, or increase constrained-link capacity.

Why it matters

Why It's Wrong: A faster link reduces serialization time and may relieve queues, but it does not reduce propagation distance or every processing delay.

iotclass.org

Deck summary

Key takeaways

A protocol header is the control information placed before a message's payload, the sensor data it carries.

  • The first arrow leads to throughput, the bits actually delivered, and the label on the way tells you what was taken: loss and retries.
  • The button is the only input; pressing it injects a burst of traffic, which is how you drive utilisation up on demand.
  • The Mistake: "We upgraded from 100 Mbps to 1 Gbps, so our IoT sensor latency should decrease 10x.".
iotclass.org

Retrieval practice

Recall check 1 of 4

Packet Pete says: answer from memory, then check your reasoning.

Q1A packet has 80 payload bytes and 20 header bytes. The link sends at 1 Mb/s. How long does serialization take, ignoring other delays?

A0.64 ms, counting the 80 payload bytes but no headers.
B0.1 ms, treating bytes as if each were a single bit.
C0.8 ms, sending 100 bytes or 800 bits at 1 Mb/s.
D8 ms, using a rate ten times slower than the stated link.
Show answer

Answer: C Include header and payload, convert bytes to bits, then divide by the link rate.

iotclass.org

Retrieval practice

Recall check 2 of 4

Packet Pete says: answer from memory, then check your reasoning.

Q2What uses timestamped requests and replies to estimate network path delay?

ANetwork Under Test
BLatency Probe
CThroughput Probe
DPacket Loss Monitor
Show answer

Answer: B Timestamped requests and replies estimate path delay under the stated clock and direction assumptions.

iotclass.org

Retrieval practice

Recall check 3 of 4

Packet Pete says: answer from memory, then check your reasoning.

Q3A factory Wi-Fi link has a stated 54 Mbps PHY rate, while sensors measure 12 Mbps of delivered data during peak hours. What do these two figures establish?

ABandwidth is the maximum theoretical capacity while throughput is the actual achieved rate
BThe Wi-Fi access point is faulty and operating at reduced speed
CThe sensors are misconfigured and only connecting at 12 Mbps instead of 54 Mbps
DThe factory needs to upgrade to 802.11ac to achieve the advertised speeds
Show answer

Answer: A The stated 54 Mbps PHY rate is distinct from 12 Mbps measured throughput; 12/54 = 22.2%. Diagnose health against the workload target and measured errors, retries, and contention rather than this ratio alone.

iotclass.org

Retrieval practice

Recall check 4 of 4

Packet Pete says: answer from memory, then check your reasoning.

Q4An industrial IoT system monitors a robotic arm using sensors that send position data every 10 ms. One-way delay ranges from 5 ms to 45 ms despite a 15 ms average, and control logs show late updates coincide with unstable motion. Which reported metric should the team investigate first and why?

ABandwidth, because position data requires high throughput
BLatency, because 15 ms average delay causes the robot to lag behind real-time
CJitter, because timing variation drives instability.
DPacket loss, because missing a single position update would crash the robot
Show answer

Answer: C The 5–45 ms delay range spans 40 ms, so the 15 ms mean hides late updates.

iotclass.org

Print reference

Answers

Answer key.

  1. C · Include header and payload, convert bytes to bits, then divide by the link rate.
  2. B · Timestamped requests and replies estimate path delay under the stated clock and direction assumptions.
  3. A · The stated 54 Mbps PHY rate is distinct from 12 Mbps measured throughput; 12/54 = 22.2%. Diagnose health against the workload target and measured errors, retries, and contention rather than this ratio alone.
  4. C · The 5–45 ms delay range spans 40 ms, so the 15 ms mean hides late updates.
iotclass.org